LOCATION INSIGHTS
Demographics, purchasing power, footfall, competition, construction projects, and zoning plans – for any location, on one platform. Location Insights turns scattered data into a site evaluation in minutes: comparable, current, and verifiable.

The problem
One tool for demographics, one for building law, a spreadsheet for scoring.
The result: hours of manual research, scattered data, and …
10+ tools & spreadsheets
Hours per site report
Hard to justify to the committee
What exactly is Location Insights?
THE REPORT
Data tells you what is.
Location Insights tells you what it means.
QUIN, our AI agent, reads more than numbers: building law, planned construction projects, and municipal decisions – and distills them into a clear assessment of opportunities and risks.
1
Overall assessment
AI interpretation: opportunities and risks at a glance.
2
Summary
The key findings, distilled and committee-ready.
3
Macro analysis
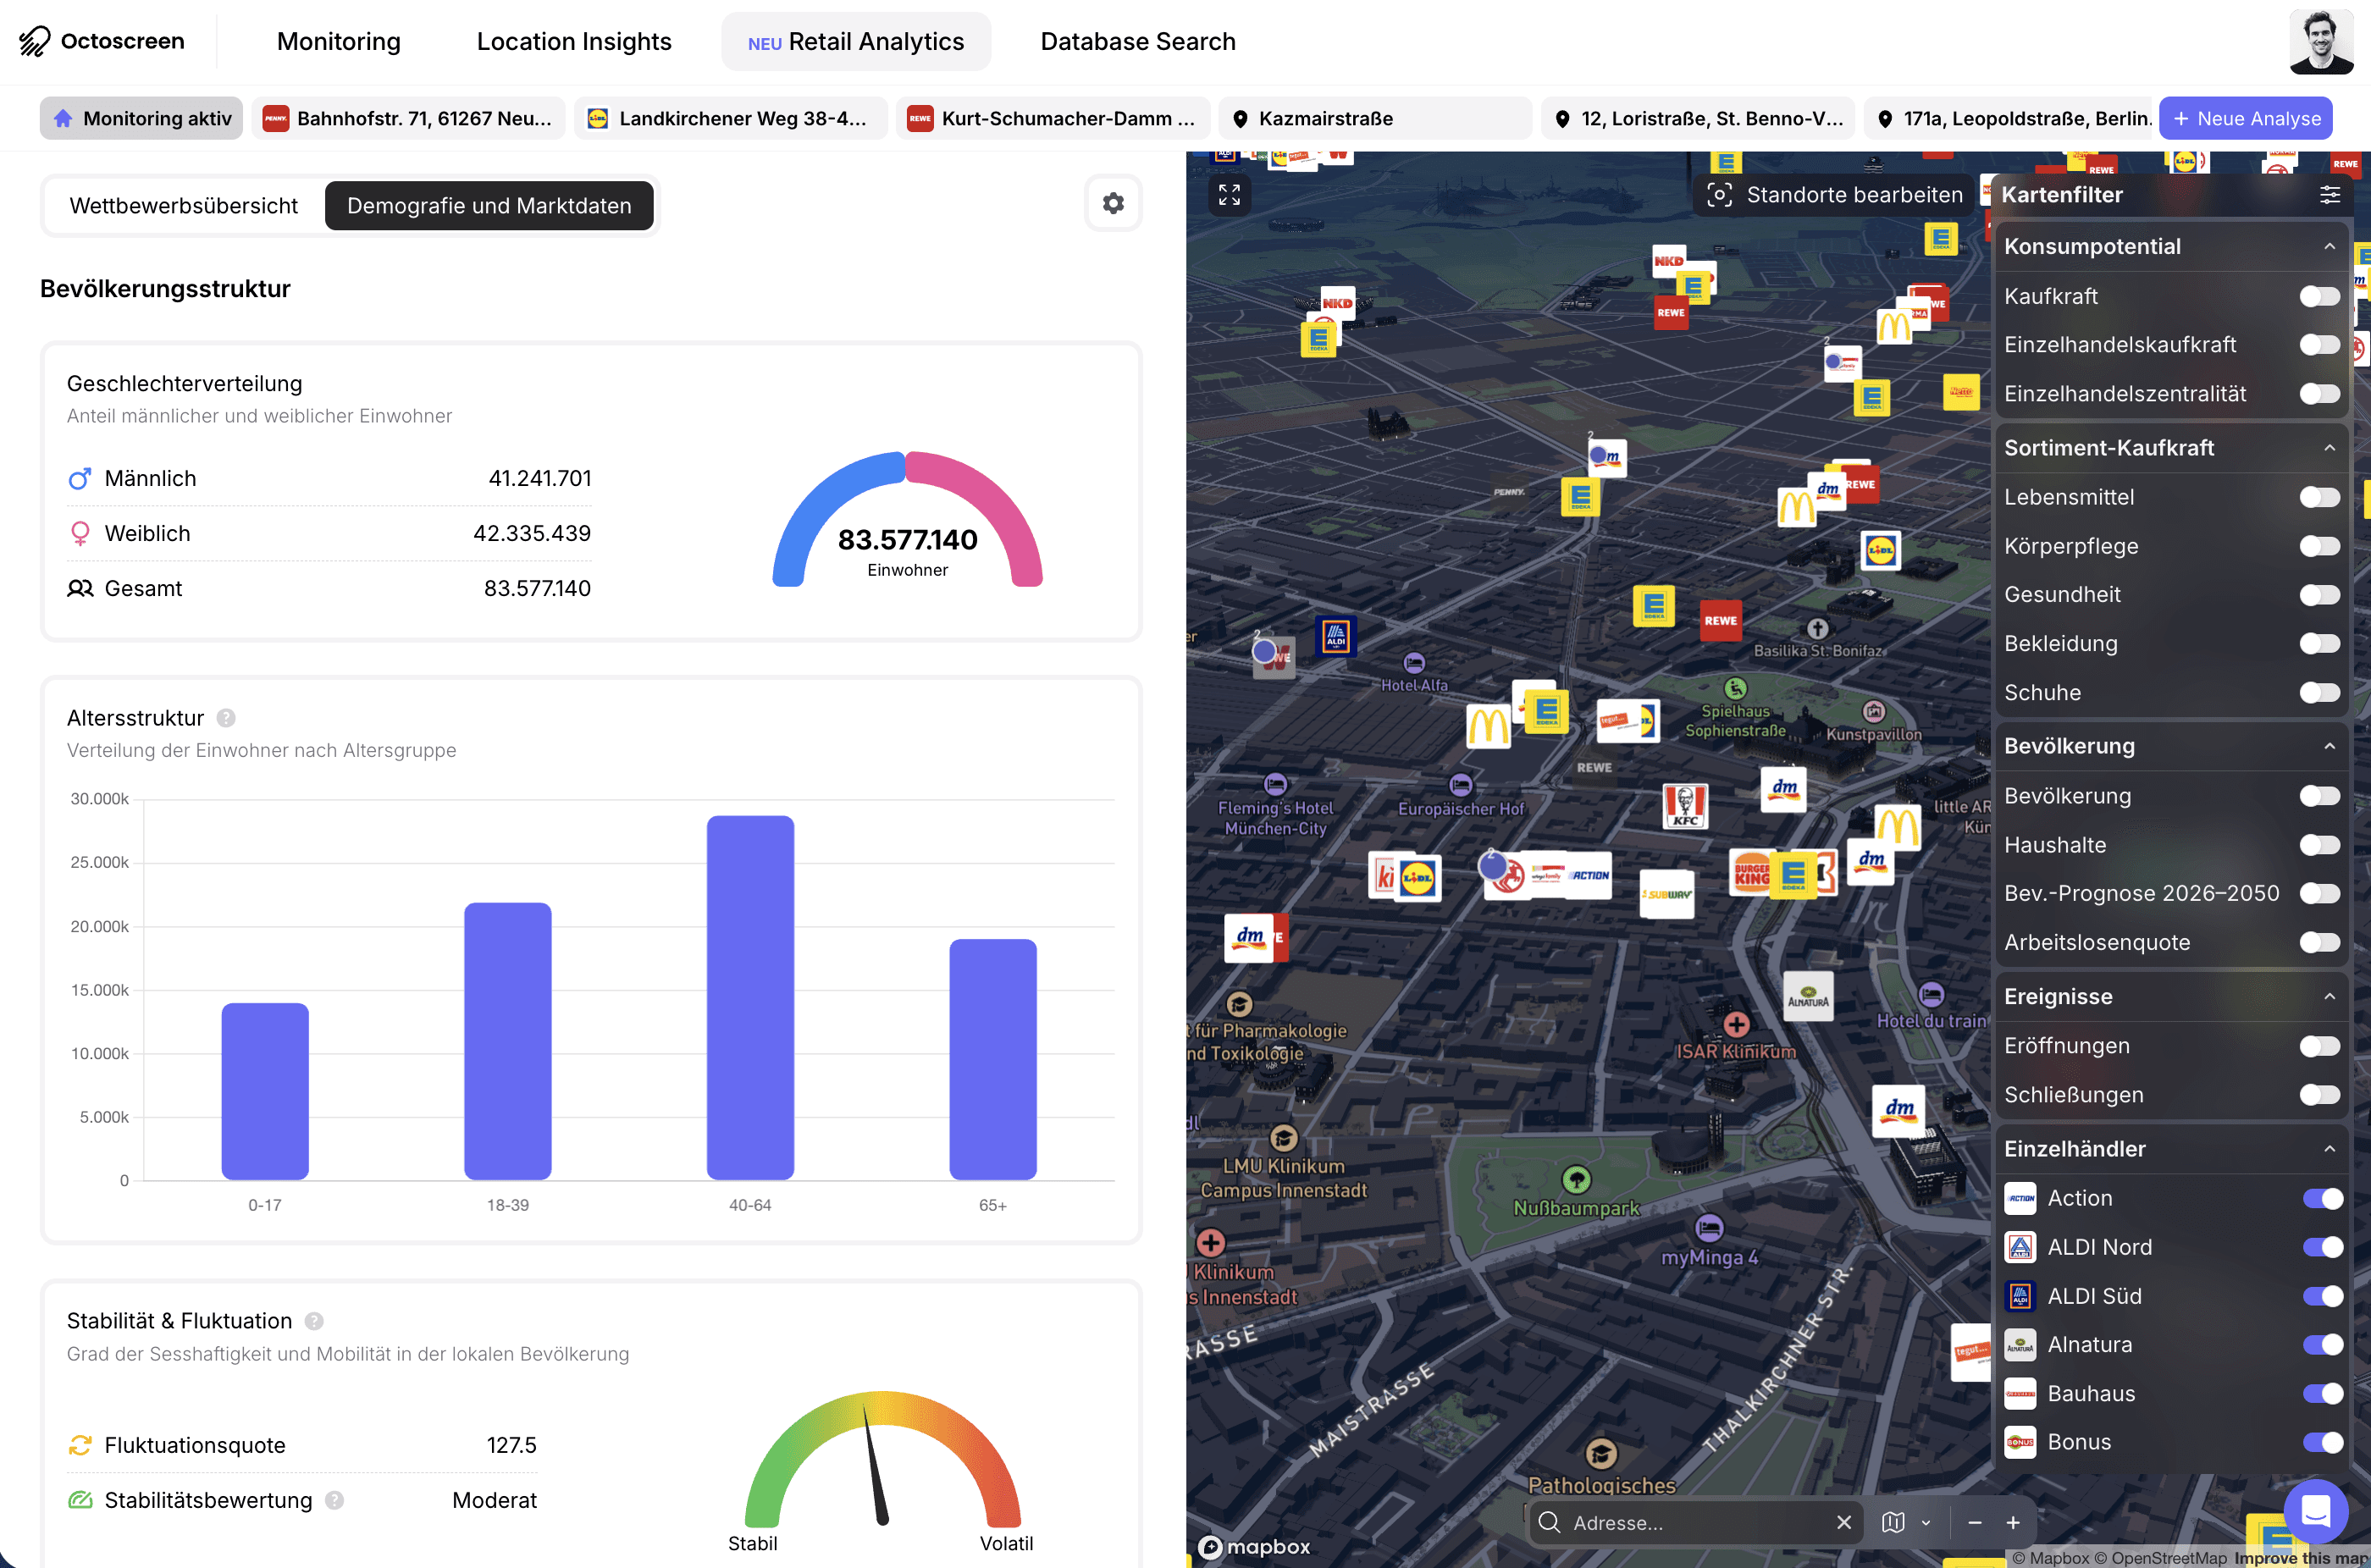
Demographics, purchasing power, and market data for the region.
4
Micro analysis
The catchment area in detail – down to the individual location.
5
Planning & building law
Current building law and relevant zoning plans.
6
Construction projects
Planned and ongoing developments in the area.
7
Local events & decisions
Municipal signals that change the location.
8
Competition
Competitor locations, store networks, and supply gaps.
9
Opportunities
Concrete potential for your location.
10
Risks
What you need to know before you decide.

FAQ
What is Location Insights?
Location Insights is Octoscreen's site analysis platform. It evaluates any location at the push of a button based on demographics, purchasing power, footfall, retail centrality, competition, construction projects, and zoning plans – comparable across all sites and verifiable down to the source.
What data does Location Insights provide?
Location Insights covers six data layers: demographics and population, purchasing power and spending potential, footfall and location quality, competition in retail, construction projects across five asset classes, and over 214,868 digitized zoning plans.
Who is Location Insights for?
For everyone who analyzes and evaluates locations: retail expansion teams, real estate and investment teams, project developers, and anyone managing store networks and portfolios.
What is the Footfall Indicator (PFI)?
The PFI is an objective metric for the footfall strength of a location. It scales from 0 to 10 – from a secondary location to a prime location – and makes sites comparable across Germany.
How does Location Insights differ from pure demographics or footfall tools?
Location Insights connects site data with building law, zoning plans, and municipal signals and interprets them via AI into opportunities and risks. Every statement is source-backed – instead of just delivering numbers, the platform delivers a justifiable assessment.
How quickly is a site analysis available?
A complete, committee-ready site evaluation is produced in seconds instead of hours of manual research.
